
Wholesale numbers released by the Society of Indian Automobile Manufacturers (SIAM) for May 2021 reveals a rather sombre story for vehicle manufacturers across the board.
Vehicle production was impacted almost in every Indian state considering the strict lockdowns announced by State governments, resulting in overall fall in wholesale numbers. Many OEMs used the period to close plants to undertake annual maintenance.
Overall, SIAM reported sales of 88,045 units of passenger vehicles (including 1,352 units of vans); 1,251 units of three-wheelers and 352,717 units of two-wheelers in May 2021, accounting for a total of 442,013 units, excluding commercial vehicles.
Compared to the wholesale volume of 2,004,137 units in May 2019, May 2021 numbers show a drop of 78% in wholesale volumes to close at 442,013 units. The YoY comparison (2021 over 2020), however, shows a 40% jump in wholesale volumes. The peak outbreak of COVID-19 during May 2020 had seen wholesale volumes drop to 315,638 units only.
This feature analyses the sales volume in the first five months of CY21, across the passenger vehicles segment – with focus on passenger cars and utility vehicles.
Expected fall in volumes
As was expected, volumes dropped across all segments and for every manufacturer in May 2021.
Passenger Cars
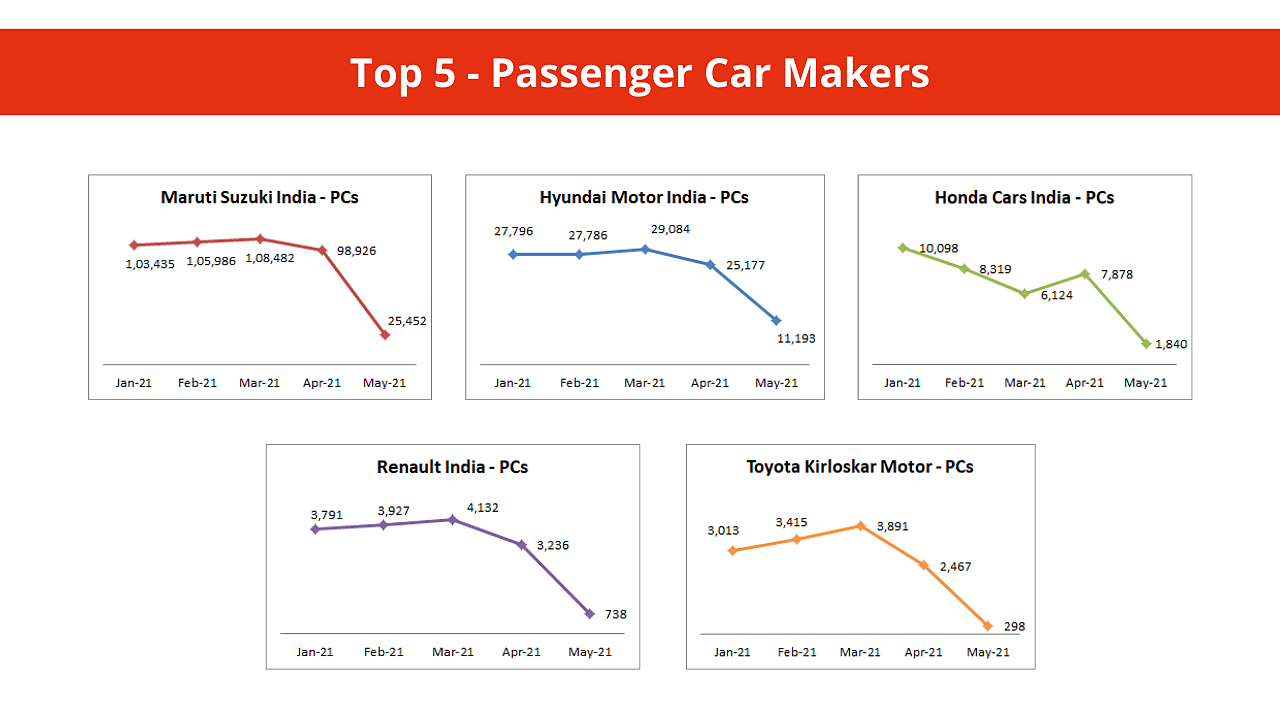
In the passenger car segment, MoM sales fell 70.58% to 41,536 units from a month ago volume of 141,194 units. Nissan Motor India saw sales drop 93.88% MoM to just 23 units in May 2021, while sales of Toyota vehicles dropped 87.92% to 298 units from the 2,467 units it sold in April 2021. Market leader Maruti Suzuki India saw volumes drop 74.27% MoM, while sales of Hyundai Motor India fell 55.54%.
One notable mention in this segment is that of Volkswagen India. While every OEM reported massive drop in volumes, VW India – despite its small volumes – reported MoM sales drop of only 6.6%. Even in the YTD analysis, VW
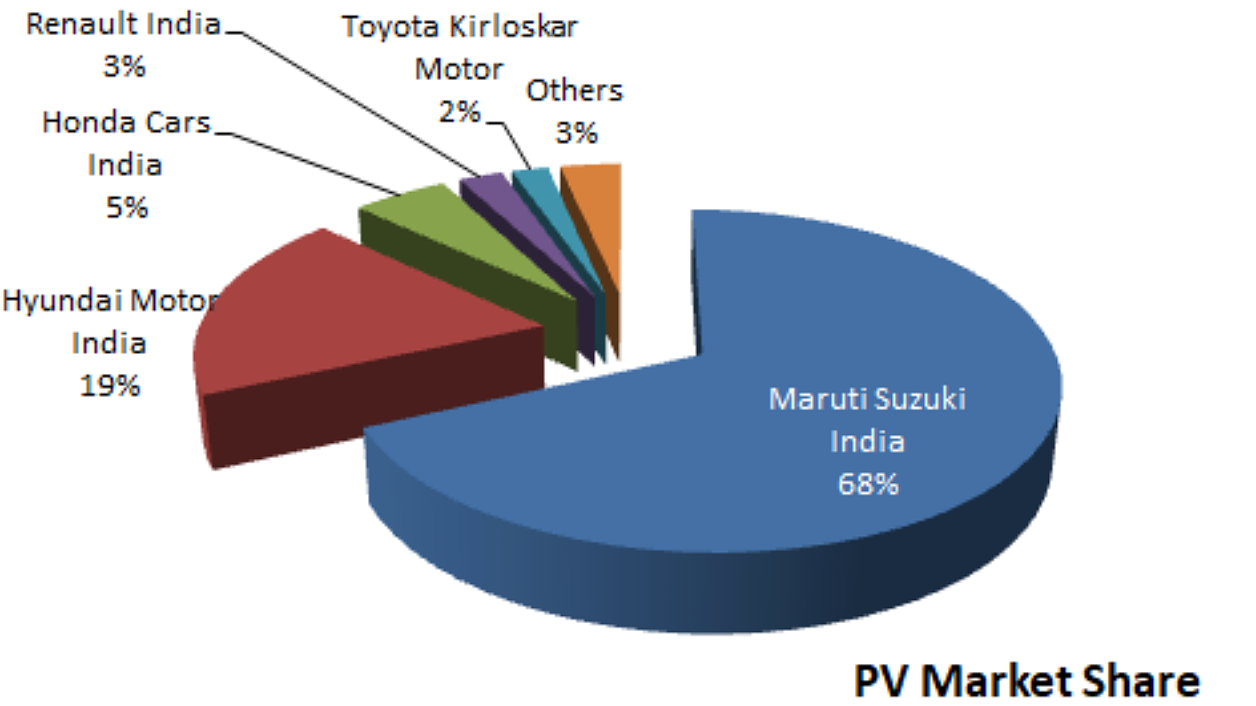
Overall, in the first five months of the calendar year, Maruti continued to lead the passenger car segment with 442,281 units, which is 68.24% of the market. This is despite the company just accounting for 25,452 units in May 2021.
Second-placed Hyundai, on the other hand, cornered 18.68% of the segment share with YTD volumes of 121,036 units. Looking at the overall numbers for Hyundai across passenger cars and utility vehicles, the company clearly seems to have an edge with its range of UVs among consumers in the passenger vehicle segment.
The list of top five passenger car makers in the analysed period is completed by Honda Cars India, Renault India and Toyota with 5.29%, 2.44% and 2.02% respectively. The remaining 3.33% was contributed by seven other manufacturers in the passenger car segment.
Analysis of the MoM change in volumes across OEMs throws some interesting insights. Here we focus on the top five passenger car manufacturers.
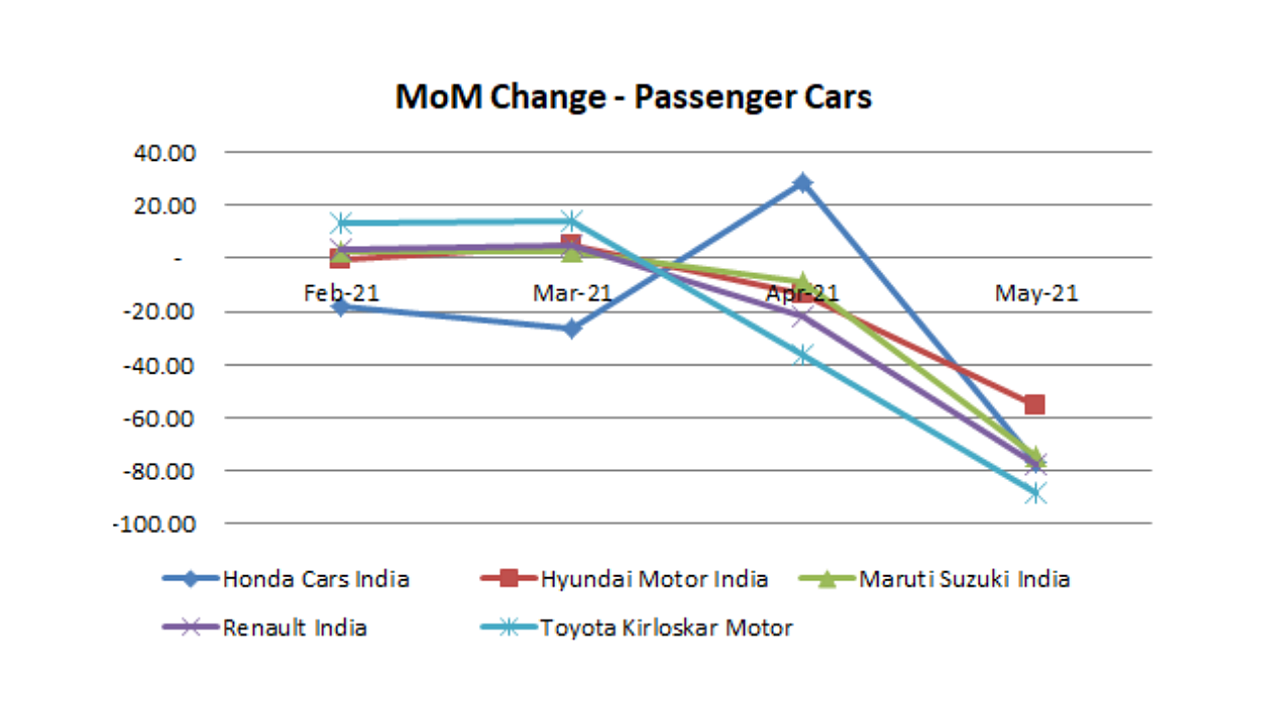
Albeit in small volumes, Maruti continued to grow MoM in February (2.47%) and March (2.36%), but volumes dropped 8.81% in April over March and a significant 74.27% in May over April. Hyundai had a miniscule drop of 0.04% in February over January, and then grew 4.67 in March over February. Sales started falling thereafter, with a drop of 13.43% in April over March and 55.54% in ay over April.
Honda, meanwhile, has been witnessing a steady drop through the YTD period, barring its growth of 28.64% in April over March. In February, the Japanese carmaker reported a 17.62% drop over January volumes, while in March, volumes dropped 26.39% over February. While April grew, sales in May (1,840 units) dropped a massive 76.64% from the 7,878 units it sold in April 2021.
Although small in overall volumes, Renault and Toyota had similar trends. Both companies grew MoM in February and March over their previous months, but sales started to fall thereafter.
Renault, for instance, grew 3.59% and 5.22% in February and March this year, while Toyota grew 13.34% and 13.94% in the same months. The following months saw sales drop by 21.68% and 77.19% for Renault, and by 36.60% and 87.92% for Toyota.
Utility Vehicles
In the UV segment, the competition among the top five manufacturers was far closer as compared to the PC segment. Maruti led the UV segment as well with 101,357 units, which gave them a share of 21.48% in the UV space. Hyundai followed with 20.91% share with volumes of 98,672 units.
Third and fourth placed Kia India and Mahindra & Mahindra had just 21 percentage points separating them. While Kia sold 78,413 units for a 16.62% share, M&M accounted for 77,412 units that gave them a 16.41% share. With sales of 32,126 UVs in the YTD period, Toyota was placed with a segment share of 6.81%.
Ten other OEMs in the UV segment accounted for the remaining volumes of 83,830 units, giving them a collective share of 17.77%.
As with the passenger car segment, we focus on the top five UV makers for this analysis on a MoM basis.
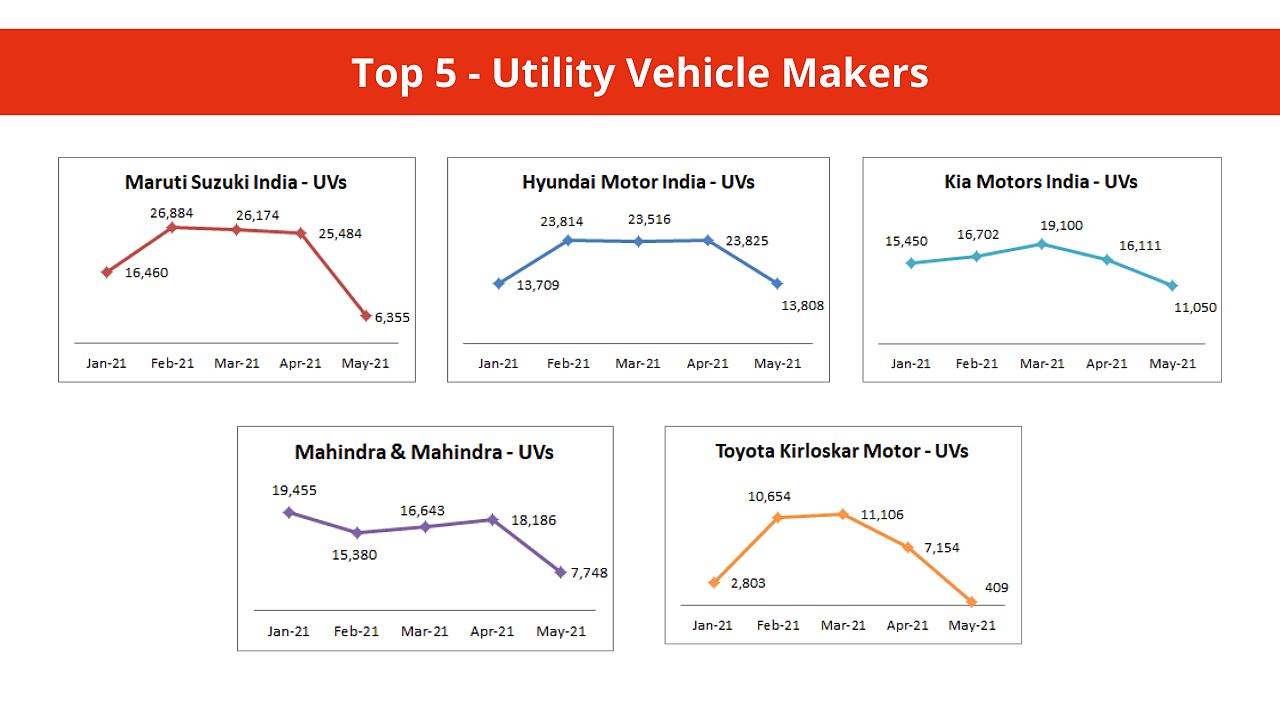
Toyota saw the biggest drop MoM in May, when volumes fell 94.28% to 409 units as compared to 7,154 units in April. Interestingly, Toyota had also seen a massive 280.09% jump in sales in February to 10,654 units over January’s 2,803 units.
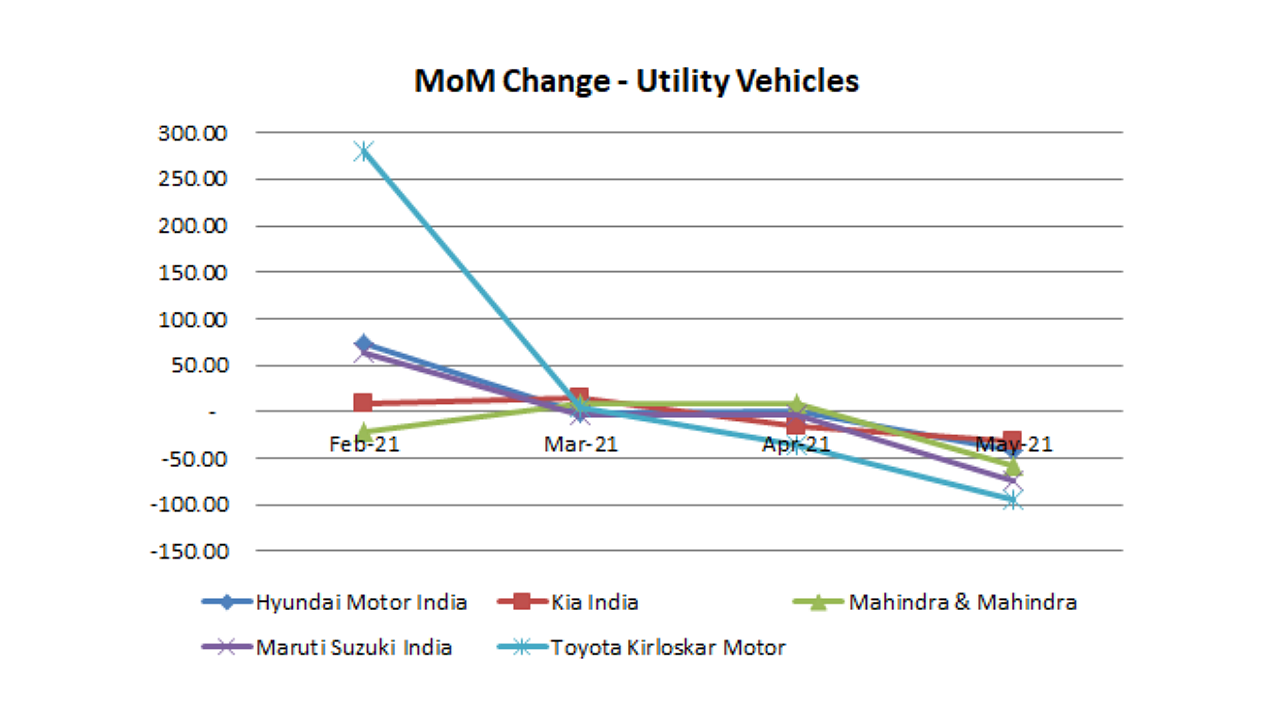
Maruti, the leading UV maker in the analysis period, saw volumes jump 63.33% in February over January’s 16,460 units, but fell by an identical 2.64% in March and April. May volumes fell over 75% MoM to 6,355 units.
Like Maruti and Toyota, Hyundai too grew handsomely in February over January, witnessing a 73.71% MoM growth to close the month with 23,814 units. Sales dropped by a small margin of 1.25% the following month, only to rise again by 1.31% MoM in April. Although sales dropped 42.04% in May over April, Hyundai clearly had one of the more stable sales performances among the top UV players in the YTD period.
The battle of the pure UV makers – Kia and Mahindra – is an interesting study. Kia pipped Mahindra to the third spot by a difference of just 1,001 units in the five month period.
MoM analysis show that Kia grew by 8.10% and 14.36% in February and March over their previous months, while the following two months saw the company’s volumes drop by 15.65% and 31.41% respectively.
Mahindra reported a drop of 57.40% in May over April. The company had reported positive growth in March and April over February and March respectively, while UV volumes had fallen in February over January by 20.95%.
Overall YTD volumes
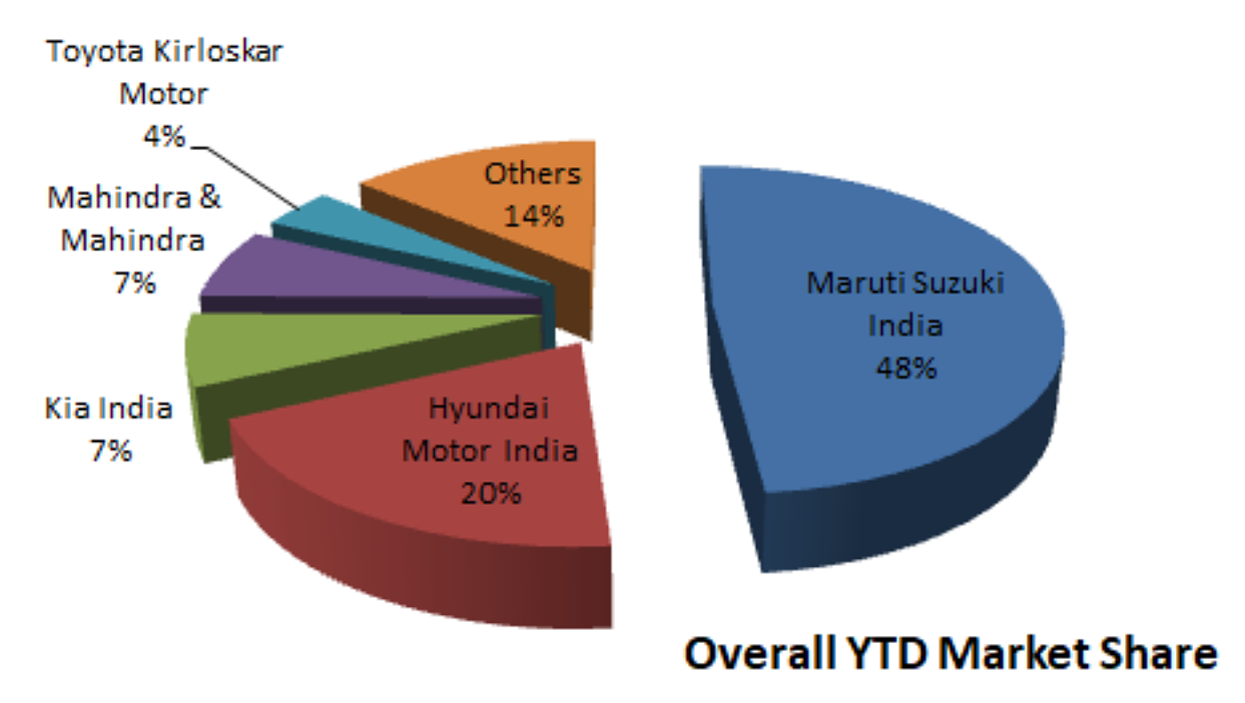
In the overall passenger vehicle segment across passenger cars and utility vehicles, the January to May 2021 period saw total sales of 1,119,897 units. Of this, Maruti cornered 48.5% share with total sales of 543,638 units, while Hyundai stayed in the second spot with 219,708 units, giving them a 19.6% share.
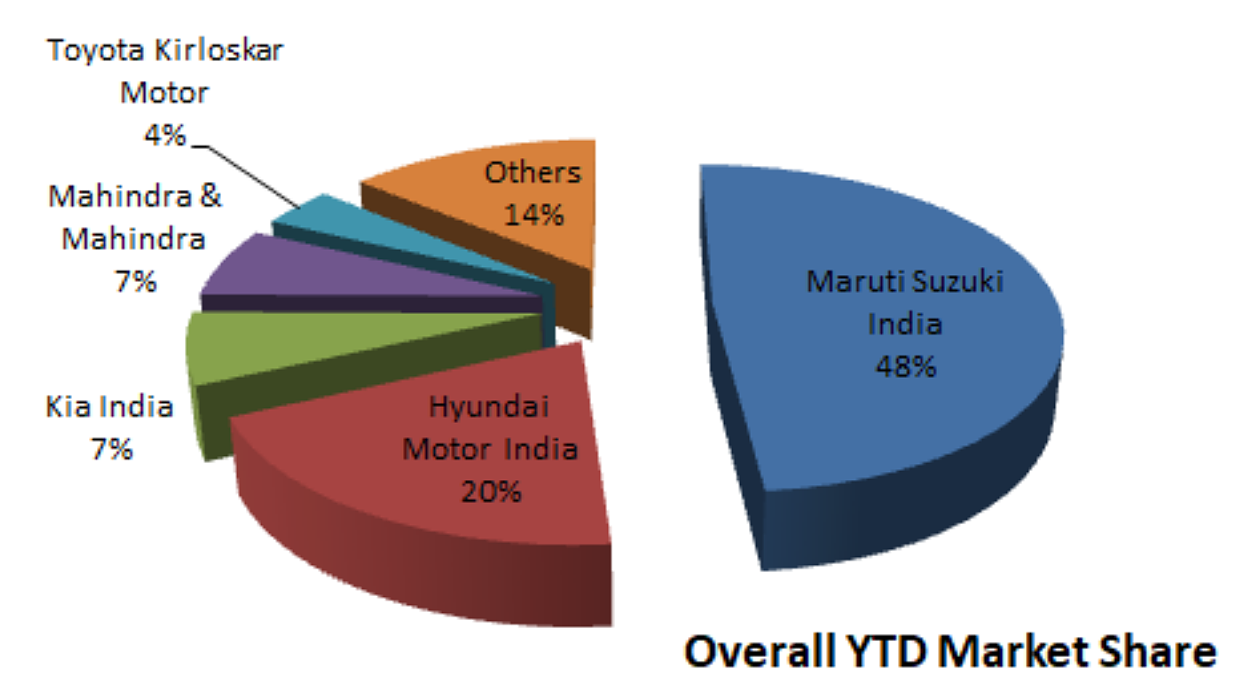
Buoyed by their strong performances in the UV space, Kia and Mahindra grabbed the third and fourth spots respectively in the PV segment with segment shares of 7% and 6.9% respectively. Toyota, with 4% segment share, was placed fifth in the pecking order. All other OEMs collectively garnered 13.9% of the segment with total volumes of 155,515 units in the five month period.
Round-up
With a gradual decline in COVID infections across the country, the situation in the coming months is expected to get somewhat better. With the fear of a third wave looming large on the country, the industry would be taking cautious steps in the coming months. While manufacturers get back to full scale production, the retail segment would hope to benefit from the pent up demand in the market.